You can’t improve what you don’t measure.
Most veterinary practices track revenue (and they should!) but inventory often remains a black box. You know you’re spending money, but without the right metrics, it’s hard to know if you’re spending it wisely.
The good news is that you don’t need to become a data scientist or drown yourself in spreadsheets. These five metrics will give you a much clearer picture, helping you make better decisions without drowning in data:
1. Cost of Goods Sold (COGS) Percentage
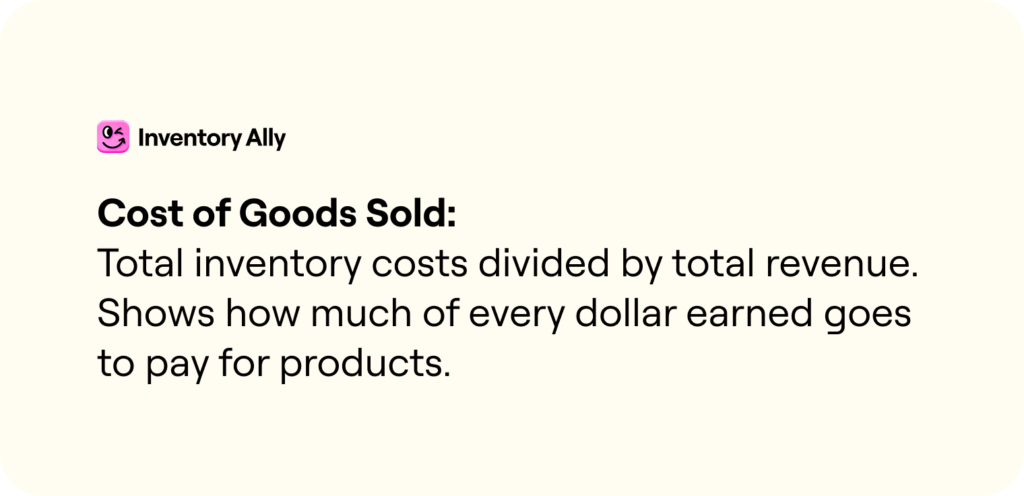
What it is: “Total cost of inventory spend (including medications, supplies, diagnostics, and related expenses) in a month, divided by the total revenue generated in the same month.
Why it matters: This is your single most important inventory profitability indicator. It tells you how much of every dollar you bring in is going right back out the door to pay for the products you use and sell. Any savings in COGS as a percentage of revenue goes straight to profitability, meaning every point you reduce this metric directly improves your bottom line.
What’s “good”: This varies significantly based on your practice type, service mix, and market. A general practice typically runs between 18-22%, but that’s not the whole story. An ER hospital might run 8-12% because their revenue from services (rather than product sales) is much higher. A large animal practice, on the other hand, might run 28-32% or higher and still be in healthy territory.
Size, maturity, and location also matter. A single-doctor GP in a rural area will likely run 24% or higher, while a 6-doctor GP practice in an urban area might achieve 18% or better. The key is knowing what’s typical for your practice type and tracking whether you’re trending in the right direction.
Real example: Let’s say your practice brings in $2 million in annual revenue and spends $440,000 on inventory. That’s 22% COGS — right in the target range. But if that number creeps up to $500,000 (25%), you’re leaving $60,000 on the table every year.
Red flags to watch for: COGS trending upward over time, wild month-to-month swings (indicating inconsistent ordering), or consistently being above your industry benchmark.
Learn more: When Profitability Hits a Dead End: 5 Strategies to Reduce COGS
2. Inventory Turnover Rate
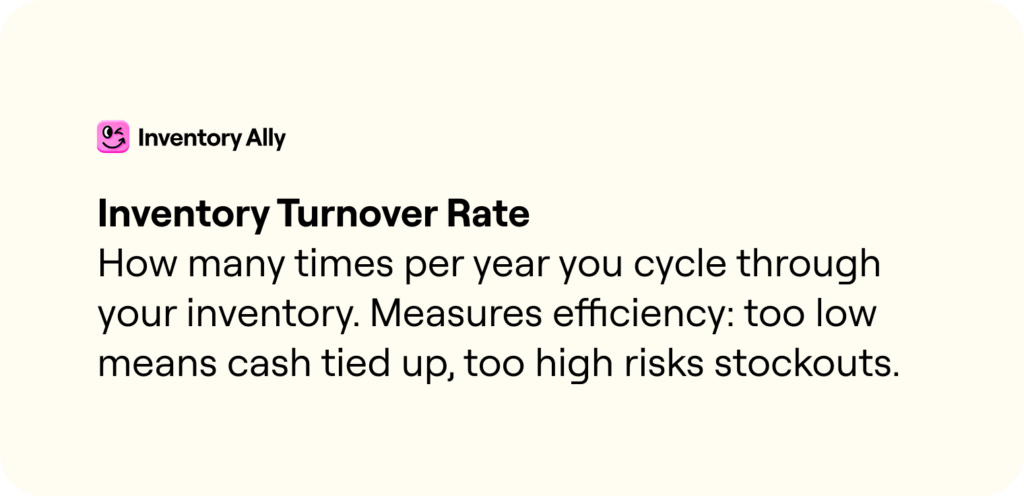
What it is: How many times per year you completely cycle through your inventory. Calculate it by dividing your annual COGS by your average inventory value.
Why it matters: This metric measures efficiency. A turnover rate that’s too low means you’re tying up cash in products sitting on shelves. Too high? You might be running lean and risking stockouts.
What’s “good”: Most veterinary practices should aim for 10-12 times per year overall, though this varies significantly by category. High-value medications and products should turn over more frequently: ideally every 3-4 weeks (about 13-17 times per year), because you want to minimize cash tied up in expensive items. Basic supplies, on the other hand, might only turn over every 12-14 weeks (3-4 times per year) since they’re lower cost and ordering them too frequently creates unnecessary administrative work.
The idea is to replace high-value items more frequently to keep cash flowing, while low-cost supplies can sit longer without significantly impacting your bottom line.
Real example: Here’s a simple spot-check: Your inventory value on hand should be roughly 20% of your average monthly revenue. So if you’re bringing in $100,000 per month, you should have about $20,000 worth of inventory on your shelves. At a 20% COGS rate, this works out to 12 turns per year, or cycling through inventory about once a month. ($100,000 × 12 months = $1.2M annual revenue; 20% COGS = $240,000; $240,000 ÷ $20,000 inventory = 12 turns.)
Pro tip: Calculate turnover separately for different categories. Your controlled substances should turn over much faster than your bulk consumables.
3. Stockout Frequency
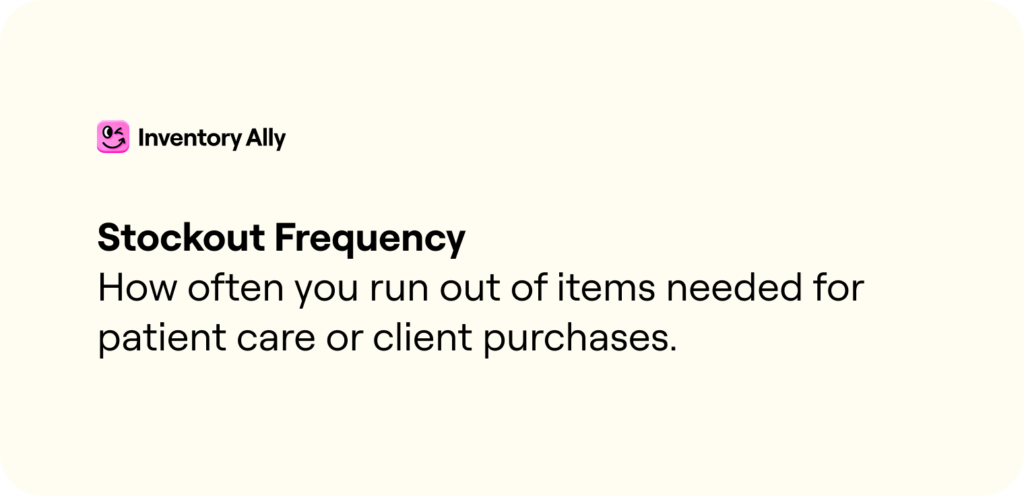
What it is: How often you run out of items you actually need for patient care or client purchases.
Why it matters: Stockouts have a direct impact on patient care, client experience, and your team’s stress levels. Nothing derails a surgery faster than realizing mid-procedure that you’re out of a critical supply.
What to track: Count the number of stockouts per month, note which items are affected, and look for patterns. Are you consistently running out of the same things? Is it seasonal? Is it happening because lead times are longer than expected?
The hidden costs: Beyond the obvious patient care delays, stockouts force you into rushed orders (often at higher prices), buying substitute products your team isn’t familiar with, or rescheduling procedures—all of which hurt your bottom line and reputation.
The goal: Aim for fewer than 2-3 critical stockouts per month. Some stockouts on low-priority items are inevitable, but if you’re regularly scrambling for essentials, your reorder points need adjustment.
4. Expiration and Waste Rate
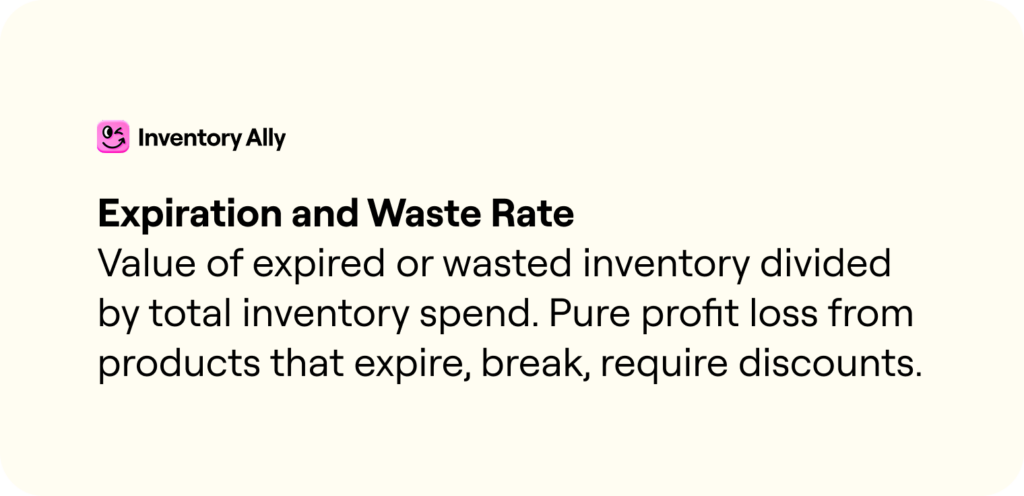
What it is: The value of expired or wasted inventory divided by your total inventory spend.
Why it matters: This is pure profit loss. Every expired vaccine or outdated medication is money you literally threw away. Even products you had to discount heavily because they were approaching expiration count as waste.
What’s “good”: Aim to keep your waste rate under 1-2%. If you’re hitting 3-5% or higher, there’s significant opportunity for improvement.
Real example: If you spend $400,000 annually on inventory and throw away $12,000 worth of expired products, that’s a 3% waste rate. Doesn’t sound like much? That’s $12,000 in pure profit that evaporated. Get that down to 1% and you’ve just saved $8,000.
Track by category: Medications typically have higher waste rates than supplies due to shorter shelf lives and stricter regulations. Knowing which categories are your biggest offenders helps you focus your efforts.
The fix: Items with defined shelf lives should be ordered more frequently in smaller quantities. Calculate the average use per month to determine how long a bottle or box will last, then set your reorder frequency and reorder points to ensure you’ll use the product well within its shelf life. For example, if a medication expires in 12 months and you use one bottle every 8 weeks, ordering every 6-8 weeks keeps you safe while minimizing waste.
5. Days of Inventory on Hand
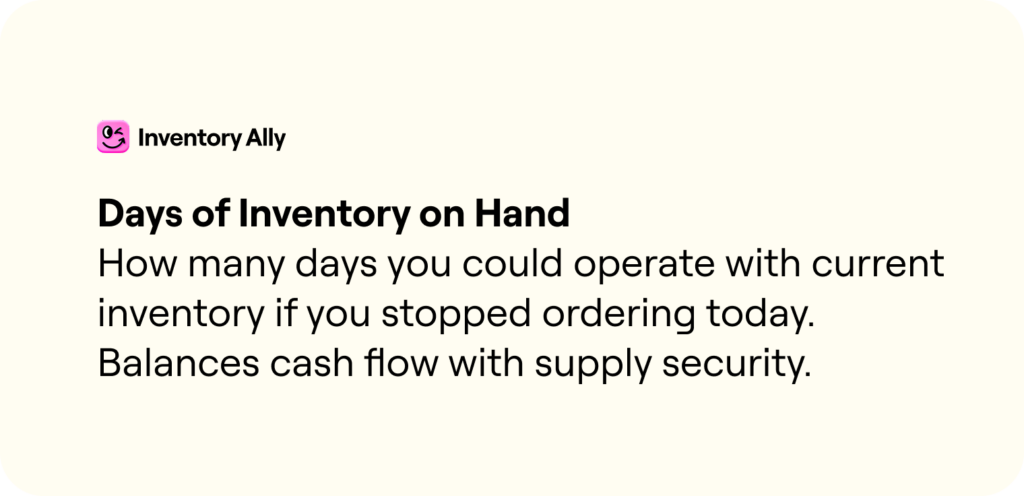
What it is: How many days you could continue operating with your current inventory if you stopped ordering today. Calculate it as: (Average Inventory Value ÷ COGS) × 365.
Why it matters: This metric balances cash flow with supply security. Too many days on hand and you’re tying up cash that could be used elsewhere. Too few and you’re at risk of running out.
What’s “good”: Most practices should aim for 30-45 days of inventory on hand, though this varies by item category and supplier lead times. Critical medications with short lead times might only need 14-21 days, while specialty items with 6-week lead times need more buffer.
Real example: If your average inventory value is $50,000 and your annual COGS is $400,000, you have about 46 days of inventory on hand. That’s reasonable, but if that number creeps up to 75 days, you’re probably over-ordering and sitting on $20,000+ in excess stock.
Bonus benefit: This metric is invaluable for cash flow planning. Knowing you have 40 days of inventory helps you forecast your purchasing needs and avoid cash crunches.
Putting It All Together
These metrics tell a story when you view them together.
For example, if you have a high COGS percentage and high days on hand, you’re probably over-ordering. You’re spending too much and it’s sitting on shelves too long. Here’s what makes this especially costly: excess inventory doesn’t just tie up cash—it drives up your COGS through shrink. Products expire, break, get stolen, or require steep discounts as they approach expiration dates. The longer products sit, the more likely they are to become waste, creating a compounding problem for your profitability.
On the flip side, if you’re seeing frequent stockouts but low days on hand, your reorder points are probably too conservative. You’re cutting it too close and paying the price in operational disruptions.
What’s often driving this: practices focusing on minimizing costs rather than optimizing turnover. The missing factor in this approach is the value of time. Hospitals operating this way typically place lots of small orders throughout the week, which not only inflates delivery costs but—more importantly—consumes valuable staff time and adds stress to a team that should be focused on client and patient care. The pennies you save on carrying costs get eaten up by the hours spent managing constant reorders and firefighting stockouts.
Or maybe your COGS looks good but your waste rate is climbing — that suggests you’re ordering the right amount overall but the wrong mix of products. You might be stocking slow-moving items that expire before you use them.
Start Small, Build Momentum
If tracking five metrics feels overwhelming, start with the right foundation: reduce your excess inventory first. This is the most impactful starting point because it removes shrink and allows your COGS to settle into a healthy baseline for your practice type. Once you’ve dialed in your inventory levels, you can then focus on optimizing margins, eliminating redundant formulary items, and leveraging supplier programs to unlock additional COGS improvements.
Stockout frequency is another great early metric to track: it’s easy to measure and immediately actionable, helping you find the balance between lean inventory and operational reliability.
The goal is visibility and steady improvement, not perfection. Even small gains add up fast. Reducing your COGS by just 1% or cutting your waste rate in half can mean thousands of dollars back in your practice’s pocket every year.
And here’s the best part: once you start measuring these metrics, they become second nature. You’ll spot trends before they become problems. You’ll make ordering decisions with confidence instead of guesswork. And you’ll finally have a clear answer when someone asks, “Is our inventory management actually working?”
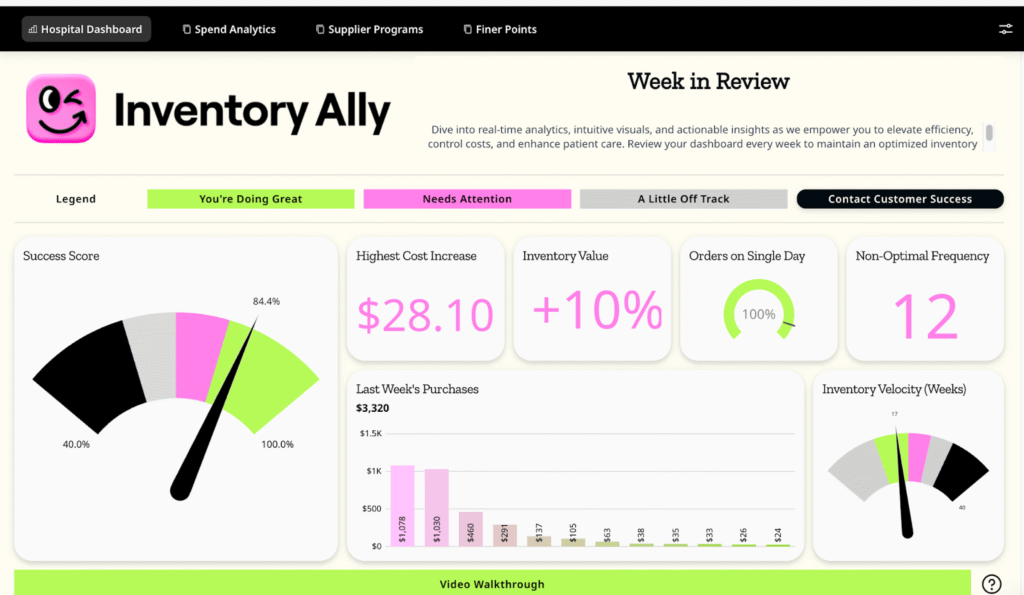
Want to see what your metrics look like without the manual work?
Inventory Ally automatically tracks key metrics like turnover rates, stockout frequency, and days on hand, giving you real-time visibility into your inventory performance without the spreadsheet headaches.
Whether you’re trying to reduce costs, eliminate stockouts, or just get a handle on what’s really happening with your inventory, we built the system to make tracking effortless so you can focus on action.